Why Mean, Standard Deviation, and SEM are Important in Research Data Analysis
Learn how to calculate Mean, Standard Deviation (SD), and Standard Error of the Mean (SEM) easily for dissertation or research data.
If you are preparing data for a dissertation, research paper, or scientific report and need to calculate the Mean, Standard Deviation (SD), and Standard Error of the Mean (SEM), you are in the right place.
In research and statistical analysis, these three calculations are extremely important because they help researchers summarize data, understand variability, and interpret experimental results accurately.
Using Microsoft Excel, these calculations can be performed quickly and accurately with built-in formulas. The Mean provides the average value of a dataset, Standard Deviation (SD) measures how spread out the data values are from the mean, and SEM indicates how precise the sample mean is compared to the true population mean.
In this guide, we will explain how to calculate Mean, Standard Deviation, and SEM step by step using simple methods. This article will help students, researchers, and data analysts understand these statistical measures and apply them correctly in their dissertation data analysis or research reports.
By the end of this article, you will clearly understand what Mean, Standard Deviation, and SEM are, why they are important, and how to calculate them easily.
We go over how to use Mean, SD, and SEM in Excel below
Mean
What is mean?
The average value of a set of numbers is called the Mean. It is calculated by adding up all of the dataset's values and dividing the result by the total number of values.
How to calculate mean in Excel:
"Mean" in Excel refers to the average value of all the numbers.
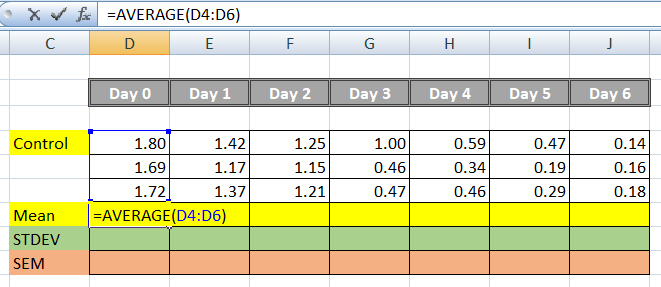
Syntax for Mean:
Average is the Excel function used to calculate the mean and D4:D6 is the range of cells that contains the data values.
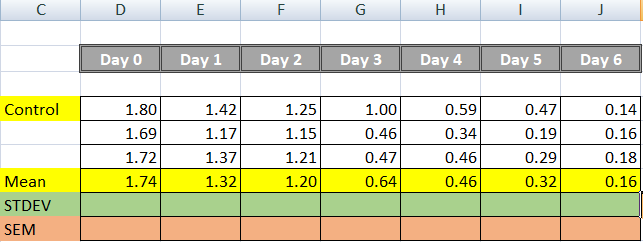
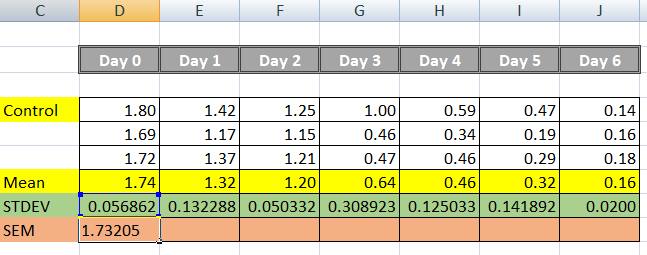
The mean value (1.74) represents the average measurement of the three control samples for Day 0. Instead of showing all three values separately, the mean summarizes them into one representative value, which makes data analysis and comparison easier in research or dissertation reports.
This same method can be applied to calculate the mean for Day 1, Day 2, Day 3, and other days by simply changing the cell range in the formula.
You can also calculate it manually,
Mean = (1.80 + 1.69 + 1.72) ÷ 3
Mean = 1.74
SD (Standard deviation):
What is SD
Standard Deviation (SD) is a statistical measure that shows how much the data values are spread out from the mean (average).
In simple terms, SD tells us how close or far the data values are from the average value.
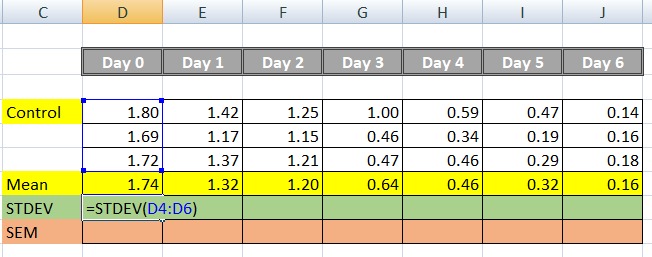
Syntax for Standard Deviation:
STDEV is the Excel function used to calculate standard deviation and D4:D6 the range of cells containing the data values.
If the STDEV value is large, the data points are more spread out, indicating greater variability in the results.
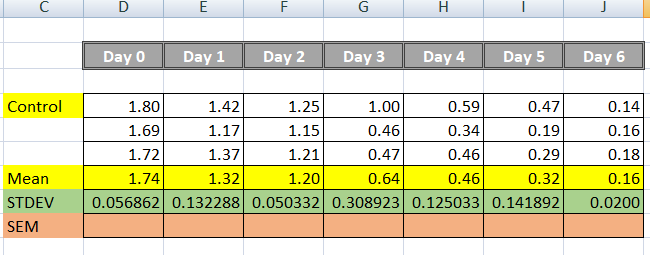
After calculating the STDEV for Day 0, the same formula can be applied to other days by changing the cell range.
| Day | STDEV Value | Consistency Interpretation |
|---|---|---|
| Day 0 | 0.056862 | Good consistency |
| Day 1 | 0.132288 | Moderate consistency |
| Day 2 | 0.050332 | Very good consistency |
| Day 3 | 0.308923 | Poor consistency (highest variation) |
| Day 4 | 0.125033 | Moderate consistency |
| Day 5 | 0.141892 | Moderate consistency |
| Day 6 | 0.020000 | Best consistency (lowest variation) |
Day 6 has the lowest standard deviation (0.020), which means the values are very close to the mean. This indicates the most consistent experimental results.
Day 2 and Day 0 also show good consistency because their standard deviation values are relatively low.
Day 3 has the highest standard deviation (0.308923), indicating large variation and poor consistency among the measurements.
SEM (Standard Error of the Mean):
What is SEM
SEM (Standard Error of the Mean) is a statistical measure that shows how accurate the sample mean is compared to the true population mean.
In simple terms, SEM tells us how reliable the calculated mean value is.
Syntax for Standard Error of the Mean:
SEM = Standard Deviation (SD) ÷ √n
Where:
SD = Standard Deviation of the dataset
n = Number of observations (replicates)
Here in above Image
D8 represents the Standard Deviation value (0.056862).
1.73205 represents the square root of 3 (√3).
Since the experiment uses triplicate results (three measurements for each day), the value of n = 3. Therefore, the denominator in the SEM formula becomes √3 = 1.73205.
Manual Example (Day 0)
SEM = 0.056862 ÷ 1.73205
SEM ≈ 0.0328
A smaller SEM value indicates higher precision and better consistency, while a larger SEM value indicates greater variability and less precision in the mean estimate.
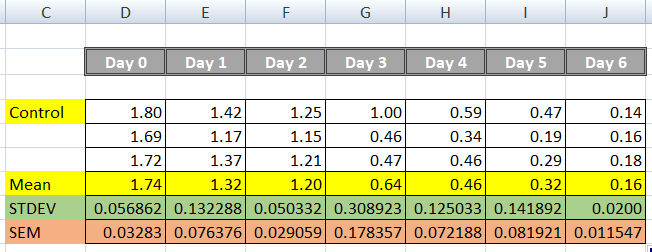
| Day | SEM Value | Consistency Interpretation |
|---|---|---|
| Day 0 | 0.03283 | Good consistency |
| Day 1 | 0.076376 | Moderate consistency |
| Day 2 | 0.029059 | Very good consistency |
| Day 3 | 0.178357 | Poor consistency (highest variation) |
| Day 4 | 0.072188 | Moderate consistency |
| Day 5 | 0.081921 | Moderate consistency |
| Day 6 | 0.011547 | Best consistency (lowest variation) |
From the SEM values:
Day 6 has the lowest SEM (0.011547), indicating the highest precision and best consistency among the measurements.
Day 2 and Day 0 also show good consistency because their SEM values are relatively low.
Day 3 shows the highest SEM (0.178357), indicating greater variability and lower precision.
Importance of Calculating Mean, Standard Deviation, and SEM
Better Understanding of Data
Mean, Standard Deviation, and SEM help researchers understand the overall behavior of the dataset and summarize large amounts of data into simple values.
Measure Data Variability
Standard Deviation shows how much the data values differ from the mean, helping researchers understand whether the data is consistent or widely spread.
Improves Research Accuracy
SEM indicates how accurately the sample mean represents the true population mean, which is very important in scientific research and dissertations.
Helps in Data Comparison
These statistical measures allow researchers to compare results between different experiments, groups, or treatments.
Essential for Scientific Reporting
Mean, SD, and SEM are widely used in research papers, dissertations, laboratory reports, and statistical analysis, making them essential for proper data presentation.
Supports Data Interpretation
These values help readers and researchers easily interpret experimental results and understand the reliability of the data.
Useful for Graphs and Data Visualization
Mean and SEM are often used to create error bars in charts and graphs, which visually represent the variability and reliability of the data.